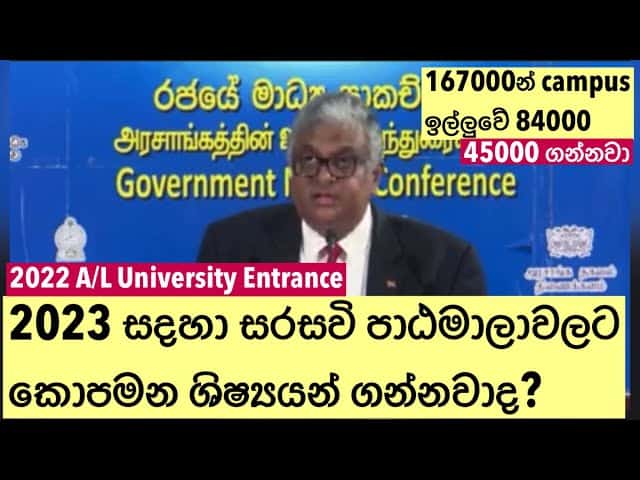
Based on the data provided by the University Grants Commission of Sri Lanka, the number of students admitted to universities for the 2022/2023 academic year, based on 2022 A/L results is 42,147.
No of students eligible and admitted to state universities
Number of students who sat for the 2022 G.C.E A/L Examination: 274,304
Number eligible for university admission: 166,967
The number who applied for admission: 84,176
Number admitted in previous 2021/2022 academic year: 41,607
Number selected under normal intake for 2022/2023: 42,147
So the number of students admitted to universities this year (2022/2023 academic year) under the normal intake is 42,147.
This is an increase of 540 students compared to the 41,607 admitted in the previous 2021/2022 academic year.
So based on the official data, 42,147 students have been admitted to universities this year under the 2022/2023 intake.
No of the students selected for each stream of study
| Number | Subject Stream | Number Sat for the A/L Examination, 2022 | Number Eligible for University Admission for the Academic Year 2022/2023 | Number Applied for University Admission for the Academic Year 2022/2023 | Number of Students Selected under the Normal Intake for University Admission for the Academic Year 2022/2023 |
|---|---|---|---|---|---|
| 1 | Biological Science | 40679 | 23182 | 15541 | 9896 |
| 2 | Physical Science | 35428 | 20144 | 13986 | 8071 |
| 3 | Commerce | 59775 | 40140 | 15415 | 7850 |
| 4 | Arts | 103476 | 64350 | 28747 | 11780 |
| 5 | Engineering Technology | 18490 | 10634 | 5308 | 2295 |
| 6 | Biosystems Technology | 8921 | 5981 | 3701 | 1536 |
| 7 | Other | 7535 | 4780 | 1478 | 719 |
Percentage of Students admitted to Sri Lankan universities in different subject streams.
| SUBJECT STREAM | Not Sat 2022 A/L | No Selected | Percentage Selected in each stream | Percentage of Total Selected to universities |
|---|---|---|---|---|
| Biological Science | 40,679 | 9,896 | 24.34% | 23.59% |
| Physical Science | 35,428 | 13,986 | 39.47% | 33.30% |
| Commerce | 59,775 | 7,850 | 13.12% | 18.70% |
| Arts | 103,476 | 11,780 | 11.39% | 28.05% |
| Engineering Technology | 18,490 | 2,295 | 12.42% | 5.47% |
| Biosystems Technology | 8,921 | 1,536 | 17.23% | 3.66% |
| Other | 7,535 | 719 | 9.53% | 1.71% |
| Total | 41,962 | 100.00% |
Distribution of bachelor’s degree candidates in Sri Lanka
Based on these statistics no of degree candidates in Sri Lankan universities for 2022/2023 academic year would be:
| SUBJECT STREAM | No Selected for different stresms | Not Selected for different streams |
|---|---|---|
| Biological Science | 9,896 | 23.59% |
| Physical Science | 13,986 | 33.30% |
| Commerce | 7,850 | 18.70% |
| Arts | 11,780 | 28.05% |
| Engineering Technology | 2,295 | 5.47% |
| Biosystems Technology | 1,536 | 3.66% |
| Other | 719 | 1.71% |
| Total | 41,962 | 100.00% |

Newly introduced courses in 2022/ 2023 Academic year


Leave a Reply